
Data measurement scales or techniques used in research.
Attitude is the way of thinking about an object, event, or person. Perception pattern creates an attitude.
In social science research, it is essential to measure the attitude of respondents regarding the research topics. Different measurement techniques are available to measure the attitude of respondents. These techniques are classified into attitude surveys and rating scales.
Every research needs to collect the required and accurate data. Accurate and required data possibly collected through specific methods or techniques. It is essential to employ Specific data collection techniques by applying different measurement scales. Such as measurement of the attitude and or behaviour of consumers done using different measurement techniques. these measurement techniques are classified as
Nominal scale
Ordinal scale
Interval scale
Ratio scale
Nominal Scale
This scale categorizes the data to identify. Numbers are assigned to the data and all the data is categorized to identify them. It can not indicate the level of the order of data. It is used to identify the data. this technique can not possibly be used in the case of knowing the degree of awareness, perception, attitudes, skills, etc.
This technique can also be called a counting technique. Still, this technique is useful in the survey to count the population and categorize it into groups and sub-groups. This technique is known as categorical and qualitative.
Example 1: To know the gender of respondents
What is your gender?
Option 1: Male Option 2: Female
Example 2: To know the preference for color
Question asked: Which are your favorite colors?
Options: i. Red ii. White iii. Yellow iv. Green v. Violate
Example 3: Numbers are given to the cricket team player to identify them.
The use of this technique is only for identification and counting if required. it can not expresses or measures the level of perception, skills, attitude, perception, or awareness.
Ordinal Scale
This technique is used to measure the data for rank or order. It compares the data based on differences. There are no equal intervals between the data. the ordinal scale is more precise than the nominal scale as it categorizes data in order and rank. This technique is used in places where rank or order is required.
To decide reward, competition, promotion, and reward to the employees are given using the ordinal scale technique. The ordinal scale is useful in the measurement of frequencies and proportions. The ordinal scale is useful in measuring frequencies, proportions, and sometimes means.
Example 1:
Sanket got 10th rank in the class and Dinesh ranked 20th in the class. The order between Sanket and Dinesh can not indicate the level of intelligence. We can not say Sanket is twice intelligent as Dinesh. In such matters the use of order scale is wasteful. So the order scale used to differential the data as greater than or less than and equal to. But it can not use in case of how much greater or less.
Example 2:
Level of Satisfaction and level of dissatisfaction. Following fig. 1 shows the difference between orders.
Example 3:
In a running competition, the distance between the first rank and second rank is not the same as that between the third and fourth ranks. On an ordinal scale, it is not possible to get equal intervals or differences.
Equal Interval Scale
The equal interval scale gives more accurate results than the ordinal and nominal scales. It has all the features of ordinal and nominal scales. The equal interval scale describes the data more specifically and it indicates both nominal and ordinal. Following table 1.1 Shows the way the data is shown by an equal interval scale. The following, Table 1.0 shows the customers who buy different products from an electronic shop.
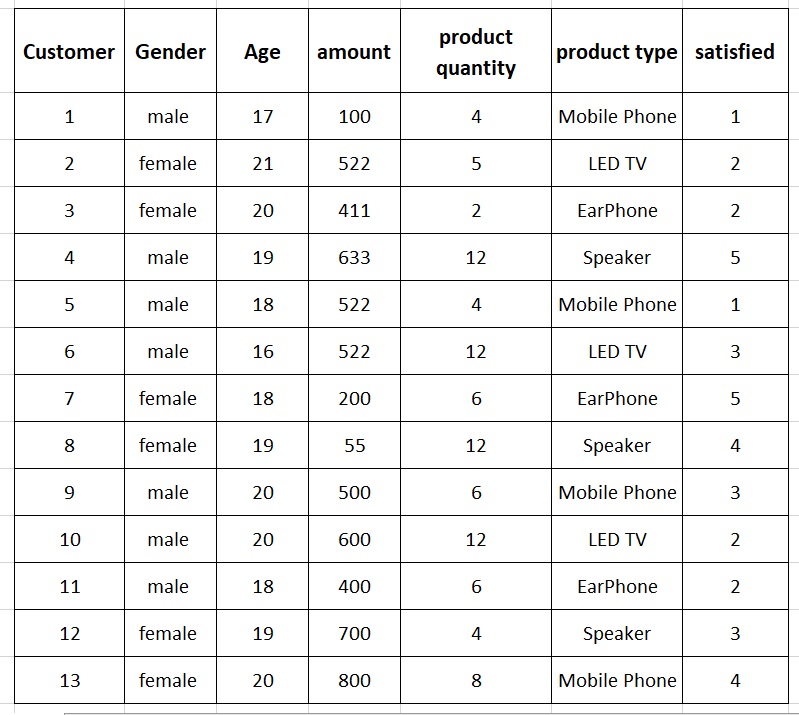
In the column of customers, some numbers represent each customer. This column shows nominal data. This data is easily shown by a pie chart or bar chart.
30 percent of customers prefer to buy mobile phones from an electronic shop. 23 percent buy LED TVs. One column of satisfied shows the ordinal data which ranks the customers as per their level of satisfaction. 1 to 5 are the ranges or ranks which are given to the customer’s satisfaction level. After calculating all the values we come to know the average level of satisfaction.
Age, amount, and product quantities are the interval and ratio data shown by bar charts or histograms. We can summarize the data as the mean average age then the mean average amount spends on purchasing the electronic products, and product quantity. These are meaningful summary statistics.
Equal interval scale has equal intervals of units of data and which is arbitrary or independent or varies with research purpose or type. An equal interval scale is useful for mean, median, and standard deviation. It does not have a true zero.
Example 1:
Zero temperature does have a specific meaning, such as water can become ice at or below zero temp. so the zero has some value. That is why an equal interval scale does not have a true zero. Jp
Ratio Scale
It is concerned with accurate data where zero is absolute. Ratio scales makes the provision of comparing the data. Ratio scale provides accurate and exact data which help to differentiate the data easily.
Examples 1: height, weight, and time are measured with a ratio scale in which values start from zero. Zero is the minimum value considered in the ratio scale.
Example 2: Typing speed of nagesh is twice greater than that of Abhishek.
Summary
Following table 1.2 shows the different features of measurement scales or techniques. This table simplify and indicate the features of each scale

The nominal scale of data measurements is less precise than the ordinal scale. The ordinal scale is less accurate than the equal interval. And ratio scale is more accurate or precise than that of ordinal and equal intervals. Equal interval is more precise than nominal and ordinal as it includes both features.
Nominal data is useful in simple data collection where no need to compare and order the data. nominal data is applied where total counting and finding out the average and percentage of data is necessary.
Ordinal data includes both the above features along with ranking or order of data. order or rank the data helps to differentiate but not accurately as much as in ratio scale.
The ratio data scale includes all the above features except zero as arbitrary. In the ratio scale, the value of zero is absolute. For example, measuring height needs to start from zero exactly.
Pingback: Attitude Measurement Techniques » Management Studies